Process Mapping
‘Process mapping’, or mapping the system of process, is a key early step in understanding an organisation. Lean manufacturing is a systems approach, and therefore a factory or organisation can only be efficient as a “system”.
For more information about the power of process mapping, take a look at the online video courses library by Rowtons Training. In particular, the Lean Manufacturing A-Z is the ideal course for the new or aspiring manager, the ambitious engineer, the high-flying consultant, the hands-on planners and the practical business analysts.
In even the simplest of organisations, there is great value in having the team make the process-map together in order to get a common perspective of what the system is that you’re working on improving. It can also uncover some fascinating and crucial different perspectives among different members of the team.
The activity of mapping with the team of people who own and do the processes is crucial, especially when it comes to the buy-in for making the changes.
Value Stream Mapping
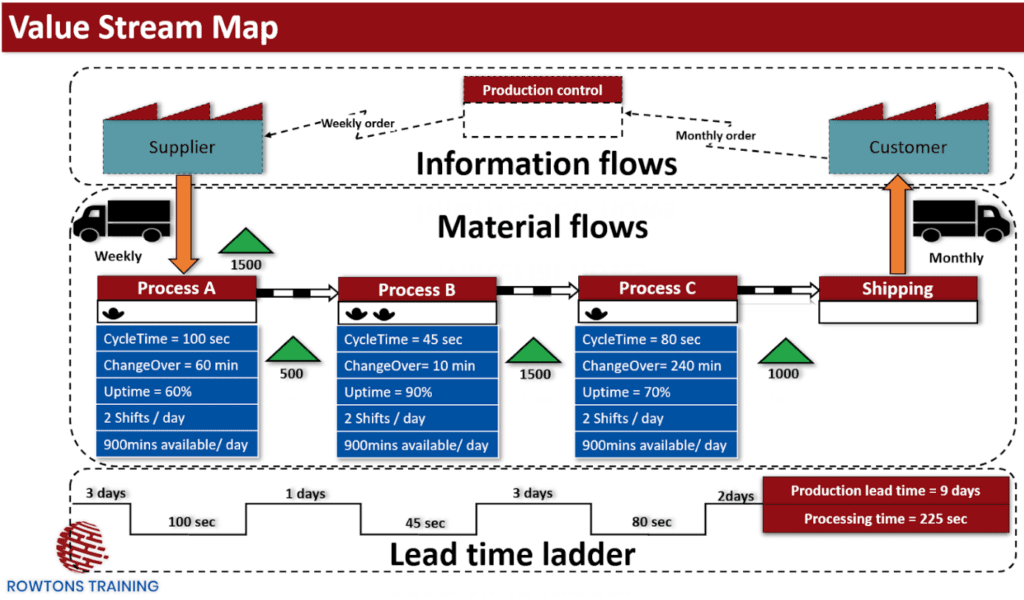
The most popular Lean method of mapping is value stream mapping. An example of a value stream map is shown below.
Value Stream Mapping (VSM) is a very particular format. However, process mapping can often begin with a simple flowchart, like the one shown below.
Getting this flowchart on paper with the team, the Lean coordinators and process supervisors is an enlightening exercise and is fundamental to getting the improvement efforts going in a clear direction.
DISCOVER THE “FORGOTTEN FUNDAMENTALS” OF OPERATIONS MANAGEMENT”
Categorising by Value Added
Another valuable exercise is to examine every step and subprocess of the system, categorising them as either “Value Adding,” “Non Value Adding” or “Necessary Non Value Adding”:
- Value Adding (VA)
The steps that really are generating value for the customer. For example, the manufacturing processes such as the cutting of materials or assembly of parts. For a service business this might include the answering of questions and solving of problems for the customer.
- Non-Value Adding (NVA)
These are steps or processes that are done but from the point of view of the customer do not create any value. In an ideal world, these step / processes would not happen at all. For example, checking for rejects, cleaning, looking for documents or rearranging internal meetings.
- Necessary Non-Value Adding (NNVA)
These are steps or processes that do need to happen within the business but are not helpful or value adding to the end customer. For example, safety audits or essential data recording. These activities need to be done, but the customer generally doesn’t care whether they are done or not.
Using colours on the process map is a powerful way of displaying this information, and is a great trigger for useful discussions about how to improve the overall system.
Value Timelines
You can also go into more detail and examine the process steps in terms of time, and how much time is spent on VA / NVA / NNVA activities. As improvement are made to the overall system, typically by removing / reducing “Non Value Adding” activities, we can visually see the time saved.
In the image above, the top bar has a total width equal to the total time of all the subprocesses, and the time of each subprocess is shown.
For a business that mostly consists of human labour, this can be used to record how a person spends their time in a typical day. This provides a good insight, and is easier to do if the person is recording how they spend their time themselves.
A worker is likely to be keen to report any activities they have to do that irritate them. The process of doing this highlights the tasks, especially non-value adding tasks, that take up their time.
Similar analysis can be done on a piece of work, or a customer going through the business.
- In a factory, this could involve tracking a product that is being made, as it moves through the system.
- In a hospital, this could involve following an individual patient and their time as they go through the hospital system.
- In a bank, this could involve following a piece of work like a customer’s credit card application, noting all of the tasks and waiting tasks that have to happen in a certain order.
For each of these examples, the timeline can be broken down into sub-processes, and visually displayed in a way that makes Value Adding, Non-Value Adding and Necessary Non-Value Adding activities clear. Seeing the sub-process displayed like this is a good visual trigger for ideas and motivation for action.
You can then work on removing non-value adding tasks, or making the value adding tasks faster. The difference in the lead time or cycle time of the overall system of processes can be seen easily.
Summary
Check out many other of my free resources, alongside the online video training courses I offer in operations management, Lean manufacturing and inventory management (and many more!).
Process Mapping is a powerful and important, if not essential early step in understanding an organisation. Where possible, you should process map together with your team, whether this is by charting out a full Value Stream Map or a simple flowchart. Process maps can be colour-coded to display Value Adding, Non-Value Adding and Necessary Non-Value Adding tasks. This is also applicable to value timelines, where the display of sub-processes is a great visual trigger for ideas and improvements.
What will your business do with all that extra time?!
Crack On!


